Skip to content
Start free
Back to Blog

Web Scraping for Market Research

Sergiu InizianLast updated on 13 min read
Web Scraping for Market Research
TL;DR: Web scraping can turn public product pages into repeatable observations of prices, assortment, and availability. Useful market research requires a defined sample, comparable products, timestamps, and quality checks; scraped listings alone do not reveal sales, demand, or market share.

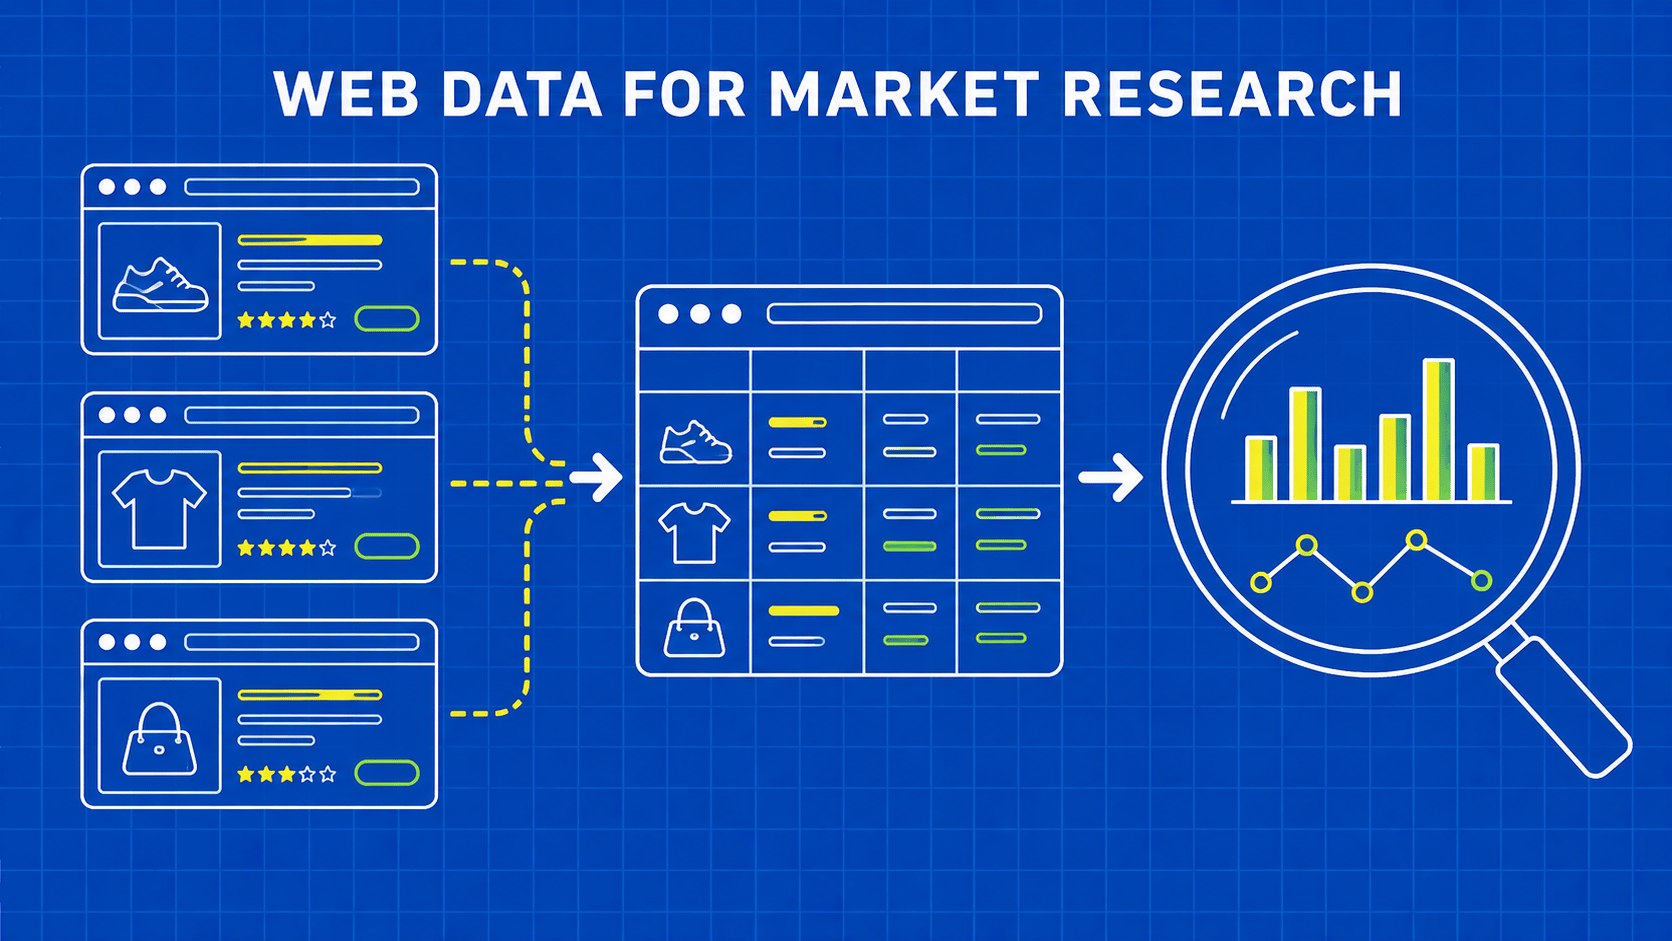
Web scraping for market research is the automated collection of website data to answer a defined question about a market or its participants. For developers, the deliverable is a dataset with traceable observations and clear limits, not simply a large collection of pages.

Price intelligence, lead generation, and brand monitoring sit next to market research among the business use cases for web scraping.

Consider a retailer comparing its prices with public competitor offers. A dashboard may show that another retailer's average price fell this week. That could reflect genuine price reductions, newly listed cheaper products, missing expensive products, or a parser that started reading installment prices. Each explanation leads to a different business decision.

Reliable research separates those possibilities before presenting a trend. You need to know what the sample covers, what each record represents, and which differences count as comparable. A product page is evidence of an advertised offer under particular conditions, not proof of a completed transaction.

This guide focuses on competitor product and pricing research because it exposes the measurement problems clearly. You will define the research question, design an observation schema, normalize prices without losing context, and validate the collection before reporting results. The same discipline applies to service directories, job listings, and other public market signals.

None of this requires a finished product: our example of web scraping for a startup launch follows a hypothetical repair-parts team testing its assumptions against public supplier pages before it builds anything.

Start web scraping for market research with an answerable question

“Monitor competitors” is too broad to turn into an extraction specification. Replace it with a question such as: “How do advertised delivered prices for matched products compare across these retailers for this destination?” That sentence identifies the entities, the metric, and important conditions before you select a scraping library.

Separate observations from interpretations in the requirements. You can observe a displayed price, a listed product, or an availability message. You may use those observations to investigate a competitive change, but stronger claims require additional evidence. A product disappearing from a page is not enough to conclude that it sold out or was discontinued.

Research question

Useful observed fields

What those fields do not establish

How do comparable offers differ?

Product identity, price, currency, shipping conditions

Actual transaction price for every customer

Which categories are listed?

Product IDs, categories, seller, observation time

Sales volume or market share

How does availability change?

Availability text and successful observation status

Units sold or warehouse inventory

How do promotions change?

Public promotion text, eligibility, validity dates

Promotion effectiveness or customer uptake

How does assortment evolve?

First and last observed dates, product attributes

Definitive launch or discontinuation dates

This is not merely cautious wording. The UK's Office for National Statistics documented a key limitation of scraped price research: listed prices do not provide the quantities purchased needed for expenditure weighting. Its 2017 research on web-scraped price data is methodological background, not a statement of today's retail market.

Write the intended decision beside the question. A merchandising team comparing assortment needs a different dataset from an analyst measuring matched price changes. Avoid collecting extra fields because they are easy to scrape if nobody can explain how they support the decision.

Design a sample that exposes its blind spots

Your source list defines the market you can actually observe. A complete crawl of three websites is still a sample of the broader market. It excludes other retailers, offline transactions, and offers hidden behind conditions outside your collection scope. More pages from the same sources cannot remove those omissions.

Create a source register before collection. Record the chosen retailers or platforms, geography, categories, access method, review owner, and reasons for inclusion. Distinguish deliberately excluded sources from sources that failed technically. Otherwise a pipeline outage can silently change the apparent market being studied.

Keep coverage separate from extraction success

Measure coverage against an explicit frame where possible: the approved retailer list, known category URLs, or a reference product panel. A successful response rate measures retrieval, not coverage. The crawler could retrieve every requested URL while failing to discover an entire category because a navigation link changed.

Track discovered products, requested pages, successful observations, and valid records separately. Preserve the reason for each loss. An unavailable product, missing price, failed request, and unmatched identifier should not all collapse into an empty row. The distinctions are essential when explaining changes in the final sample.

If you cannot estimate full coverage, say what you do know. “Observed offers from selected public category pages” is a defensible description. “The entire market” is not. Document discovery rules so another developer can reproduce the boundary of the dataset.

Use a stable panel and a discovery stream

A practical design keeps a fixed product panel for comparisons while running separate discovery jobs for new listings. The panel helps compare similar items over time; discovery reveals assortment changes that the panel would otherwise miss. Publish their counts separately because they answer different questions.

Review the panel periodically rather than quietly replacing missing products. Product churn can change a price series even when individual prices are collected correctly. ONS explored this issue in research on web-scraped clothing data. The engineering implication is to preserve entry, exit, and matching decisions alongside the observations.

Store offers as timestamped observations

Use separate concepts for a product, an offer, and an observation. The product is the item being sold. The offer adds seller and commercial conditions. The observation records what your collector saw at a particular time and under a specific context.

Schema.org Product and Schema.org Offer provide useful vocabulary for this separation, including product identifiers and offer properties such as price, currency, and availability. Website structured data can be a convenient extraction source, but do not assume it agrees with visible content or identifies the selected variant correctly. Validate representative pages before relying on it.

Field group

Suggested fields

Why it matters

Provenance

Source URL, observed time, run ID, parser version

Reproduce and audit an observation

Product identity

Source product ID, GTIN when supplied, brand, model, variant

Match like with like

Offer context

Seller, region, currency, condition, eligibility

Avoid comparing incompatible offers

Price basis

Advertised amount, shipping amount or status, tax basis

Explain what the price includes

Collection result

Fetch status, extraction status, missing-field reasons

Distinguish unknown values from real changes

Retain the original field text alongside normalized values when your approved retention policy allows it. “From 19.99,” “19.99 per month,” and “19.99” can normalize to the same number while describing different offers. Keeping the original evidence helps investigate that mistake without assuming the page still looks the same later.

Use timezone-aware observation timestamps and define how a reporting day is assigned. A price collected just before midnight in one region and after midnight in another may enter different daily summaries. Preserve the actual collection instant even if the dashboard displays local dates.

Treat corrections as traceable changes. If a parser mapped shipping into the price field, a corrected dataset should record the affected runs and transformation version. Quietly overwriting historical observations makes it difficult to explain why last week's published chart changed.

Match products before comparing their prices

An attractive title match is not enough to establish product equivalence. Compare model, variant, pack quantity, condition, and seller context before treating two offers as alternatives. A refurbished unit, a new unit, and a multipack may share most of their visible words while representing different purchases.

Use trustworthy identifiers when they are available. GS1 describes GTINs as product identity keys in its explanation of GTINs and barcodes. Preserve identifiers as strings, including leading zeros, and check that the website associates the identifier with the relevant variant. The presence of an identifier does not remove the need to validate the extracted association.

When identifiers are absent, use a staged matching process. Normalize obvious formatting differences, restrict candidates by brand and category, then compare model and variant attributes. Store a match status such as confirmed, provisional, or rejected. Route uncertain matches for review rather than quietly turning a fuzzy similarity score into a factual equivalence.

Normalize units and commercial conditions

Unit pricing can make pack sizes comparable, but only after you establish that the unit means the same thing. Comparing price per kilogram may be useful for equivalent packaged goods. It does not make products identical when concentration, quality, or included accessories differ. Keep the original pack information so analysts can choose the appropriate comparison.

Do not merge currencies into a single numeric column and compute an average. Keep original currencies and, if conversion is necessary, record the exchange-rate source, timestamp, and conversion policy. The converted amount is a derived measure rather than the original observation.

Shipping, tax, membership, and minimum basket requirements need equally explicit treatment. Unknown shipping is not free shipping. A members-only price is not a public price for every customer. Either compare a common eligible scenario or separate the cohorts so the dashboard does not rank unlike offers as direct substitutes.

Validate comparable totals with a small Python function

Put comparability checks before aggregation. The following standard-library example accepts already extracted fields and computes a delivered total only when both offers share the same product and commercial basis. It deliberately rejects unknown shipping instead of treating it as zero.

This is an illustrative validation step, not a universal product matcher or a live scraper. Its inputs assume you already resolved identity, selected the relevant offer, and normalized numeric text. Use your source-specific rules for currency validation, tax treatment, and eligibility.

from decimal import Decimal, InvalidOperation

def amount(value):
    if not isinstance(value, str):
        raise ValueError("Amounts must be normalized decimal strings")
    try:
        parsed = Decimal(value)
    except InvalidOperation as exc:
        raise ValueError("Invalid amount") from exc
    if not parsed.is_finite() or parsed < 0:
        raise ValueError("Amount must be finite and nonnegative")
    return parsed

def delivered_total(offer, expected_basis):
    for field, expected in expected_basis.items():
        if offer.get(field) != expected:
            raise ValueError(f"Incomparable field: {field}")
    if offer.get("shipping_status") != "known":
        raise ValueError("Shipping is unknown")
    return amount(offer.get("price")) + amount(offer.get("shipping"))

basis = {
    "matched_product_id": "widget-blue-small-single",
    "currency": "EUR",
    "condition": "new",
    "tax_basis": "included",
    "destination": "DE",
    "eligibility": "public",
}
offer = {
    **basis,
    "price": "24.90",
    "shipping": "3.50",
    "shipping_status": "known",
}
print(delivered_total(offer, basis))  # 28.40

Python's decimal documentation explains decimal arithmetic and why constructing decimals from strings differs from constructing them from binary floating-point values. Here the string input is intentional. The function also rejects non-finite values, since a value such as NaN should not enter a pricing report.

Extend the test cases before connecting this step to production data. Include unknown shipping, mismatched currencies, negative amounts, unavailable offers, and duplicate observations. Keep rejected records with their reason in a review stream. Silently dropping them would improve the apparent cleanliness of the dataset while hiding the coverage loss.

For the collection layer that supplies these fields, start with the simplest retrieval method that exposes the required content. The guide to Python HTTP clients covers that choice; the eBay price intelligence tutorial gives a platform-specific example to adapt after reviewing your source requirements.

Collect repeatable snapshots and detect pipeline changes

Choose a schedule that fits the research question and the permitted request policy. Frequent observations are useful only if the added detail changes the analysis. A daily assortment report does not automatically need minute-by-minute retrieval, particularly when it increases cost and complicates quality checks.

Record the collection context consistently: region, language, destination, selected variant, and any relevant public offer conditions. If that context changes, flag the break in the series. Otherwise a location change can appear to be a competitive price change.

Build a small set of reviewed fixtures covering common pages and troublesome cases. Test parsers against those fixtures when selectors or dependencies change. Live checks then confirm that the page structure and displayed values still agree with your assumptions. A successful HTTP response should never be the only acceptance condition.

Monitor missing-field rates, unexpected record-count changes, duplicate IDs, and unusually large price movements. These checks should trigger investigation, not automatic deletion of surprising values. Real promotions and extraction bugs can look similar in a chart. Compare the retained evidence, recent parser changes, and neighboring observations before deciding which explanation fits.

Keep retry outcomes separate from original attempts, and use stable observation keys so a delivery retry does not create a second product observation. For a broader implementation discussion, the Scrapy collection guide provides crawling context.

Review permitted access, site terms, and collection scope before running the job. Keep the dataset focused on the business question and minimize unnecessary personal data. Follow a bounded request policy and escalate uncertain access conditions for review. A hosted retrieval service changes who operates the network layer, not what your research project is entitled to collect.

Report price movements without inventing market share

A useful report carries its measurement rules into the output. Show the source panel, observation window, valid-record count, unmatched products, and missing sources beside the main chart. Analysts should not need to inspect a pipeline log to discover that one retailer disappeared from the sample.

R keeps collection in the same environment as the report, and web scraping in R walks through rvest from setup to saved results.

For price comparisons, identify the matched cohort and the conditions under which totals are comparable. If you show a percentage change, state whether it compares the same products in both periods or different weekly assortments. Those measures answer different questions even when their charts look identical.

Separate descriptive summaries from a formal price index. A median observed price or matched-product change can be useful for internal research, but it does not automatically meet the methodological requirements of an inflation measure. Avoid naming a simple average “market inflation” or presenting it as representative of consumer expenditure.

Likewise, listing counts are measures of observed assortment, not market share. A retailer with more indexed pages may have different pagination, more variants, or duplicated marketplace offers. Revenue share requires suitable sales and market-size evidence beyond this dataset. Keep the report's wording close to what the collection actually establishes.

End each report with the questions the data raises rather than unsupported explanations. A rising share of promotional listings may justify investigating a campaign. It does not prove that a competitor is under financial pressure. Good web scraping for market research makes those follow-up decisions more precise while preserving the distinction between evidence and interpretation.

If the findings will become published content, web scraping for content marketing covers turning observations into original research without overstating what they show.

Key Takeaways

  • Define a research question that public observations can answer, then document the missing evidence.
  • Preserve product identity, offer conditions, collection context, and timestamps before calculating comparisons.
  • Track sample coverage separately from successful requests and valid extracted records.
  • Validate matching, currency, units, tax, and shipping before ranking prices.
  • Label assortment and price measures accurately; scraped listings do not establish sales or market share.

FAQ

Can customer reviews be added to the research dataset?

Yes, but treat them as a separate evidence source with their own sampling limits. Reviewers are not necessarily representative of all buyers, and text may contain personal information. Define the permitted collection scope, minimize unnecessary identifiers, and report the platform and observation window. Sentiment classifications are derived assessments, so retain the method and uncertainty rather than presenting them as direct customer facts.

How should research results be shared with another team?

Deliver a data dictionary, source scope, timestamps, and known limitations with the records. Include the rules for missing values, product matching, and any derived fields so another analyst can reproduce the result. A versioned export is easier to audit than a spreadsheet whose values change without notice. Make the responsible owner visible for questions about interpretation or corrections.

Can AI classify products into research categories?

Yes, but evaluate its labels against a reviewed sample before using them in aggregates. Keep the category definition, model or rule version, and uncertain assignments available for inspection. A classification change can move products between groups and alter reported trends even when the source data is unchanged. Use a separate review process for new or ambiguous categories.

Conclusion

Web scraping for market research works best when you design the measurement before the collector. Define the question, choose a defensible source panel, and preserve the distinction between products, offers, and observations. Validate comparability before calculating a price difference, and expose missing coverage instead of hiding it inside an attractive chart.

Begin with one category and a small reviewed panel. Confirm that the records can answer the intended question, run the collection across repeated observations, and investigate failures before expanding the source list. Scaling an ambiguous schema only produces a larger ambiguous dataset.

If page retrieval is taking attention away from this analytical work, evaluate WebScrapingAPI's Scraper API as the retrieval component while keeping your research definitions and validation rules explicit. The value of the finished pipeline is not how much it collects. It is whether another developer or analyst can inspect a result, understand its limitations, and make a sound decision from the evidence.

About the Author

Sergiu Inizian, Technical Content Writer @ WebScrapingAPI

Sergiu Inizian

Technical Content Writer

Sergiu Inizian is a Technical Content Writer at WebScrapingAPI, creating clear, practical content that helps developers understand the product and use it effectively.

Alternative Data Scraping for Finance: Sources & Pipelines
Use Cases

Alternative Data Scraping for Finance: Sources & Pipelines

TL;DR: Alternative data scraping uses web collection techniques to gather non-traditional datasets (product pricing, sentiment, job postings, regulatory filings) that reveal market signals before they appear in earnings reports. This guide walks you through the highest-value data sources, how to build financial-grade pipelines, data quality validation, and the compliance guardrails you need to stay on the right side of the law.

Mihnea-Octavian Manolache15 min read
Read Article
What Is Financial Data? Types, Sources, and Analysis Tools
Use Cases

What Is Financial Data? Types, Sources, and Analysis Tools

TL;DR: Financial data is the collection of quantitative records (income, expenses, assets, liabilities, cash flow) that organizations and individuals use to make informed economic decisions. This guide breaks down the four core financial statements, compares traditional and alternative data sources, walks through modern collection methods, and covers the tools professionals rely on for analysis.

Suciu Dan13 min read
Read Article
XPath vs CSS Selectors: Choosing the Right One
Use Cases

XPath vs CSS Selectors: Choosing the Right One

TL;DR: XPath and CSS selectors both locate DOM elements, but they solve different problems. CSS selectors are faster and more readable for straightforward selections. XPath wins when you need to traverse the DOM in any direction, match text content, or handle complex conditional logic. Most production projects benefit from using both strategically.

Mihai Maxim12 min read
Read Article

Start Building

Ready to Scale Your Data Collection?

Join 2,000+ companies using WebScrapingAPI to extract web data at enterprise scale with zero infrastructure overhead.